We use cookies to improve your experience. By using BondbloX, you agree to our use of cookies.
Bond Market News
Fed Hikes by 25bp, Warsh Sees Timelier Return to 2% Inflation Tgt
September 17, 2026

The Federal Reserve raised its benchmark interest rate by 25bp to a target range of 3.75-4.00%, with the decision unanimously backed by the FOMC. The short-end of the US Treasury yield curve rose sharply by 4-7bp while the long-end remained steady. The updated dot plot (chart below) showed 16 of 18 officials expecting at least one further hike by year-end, with the median 2026 rate forecast rising to 4.1% from 3.75% in June. Besides, Warsh did not participate in the dot plots, echoing his preference not to provide guidance on the same.
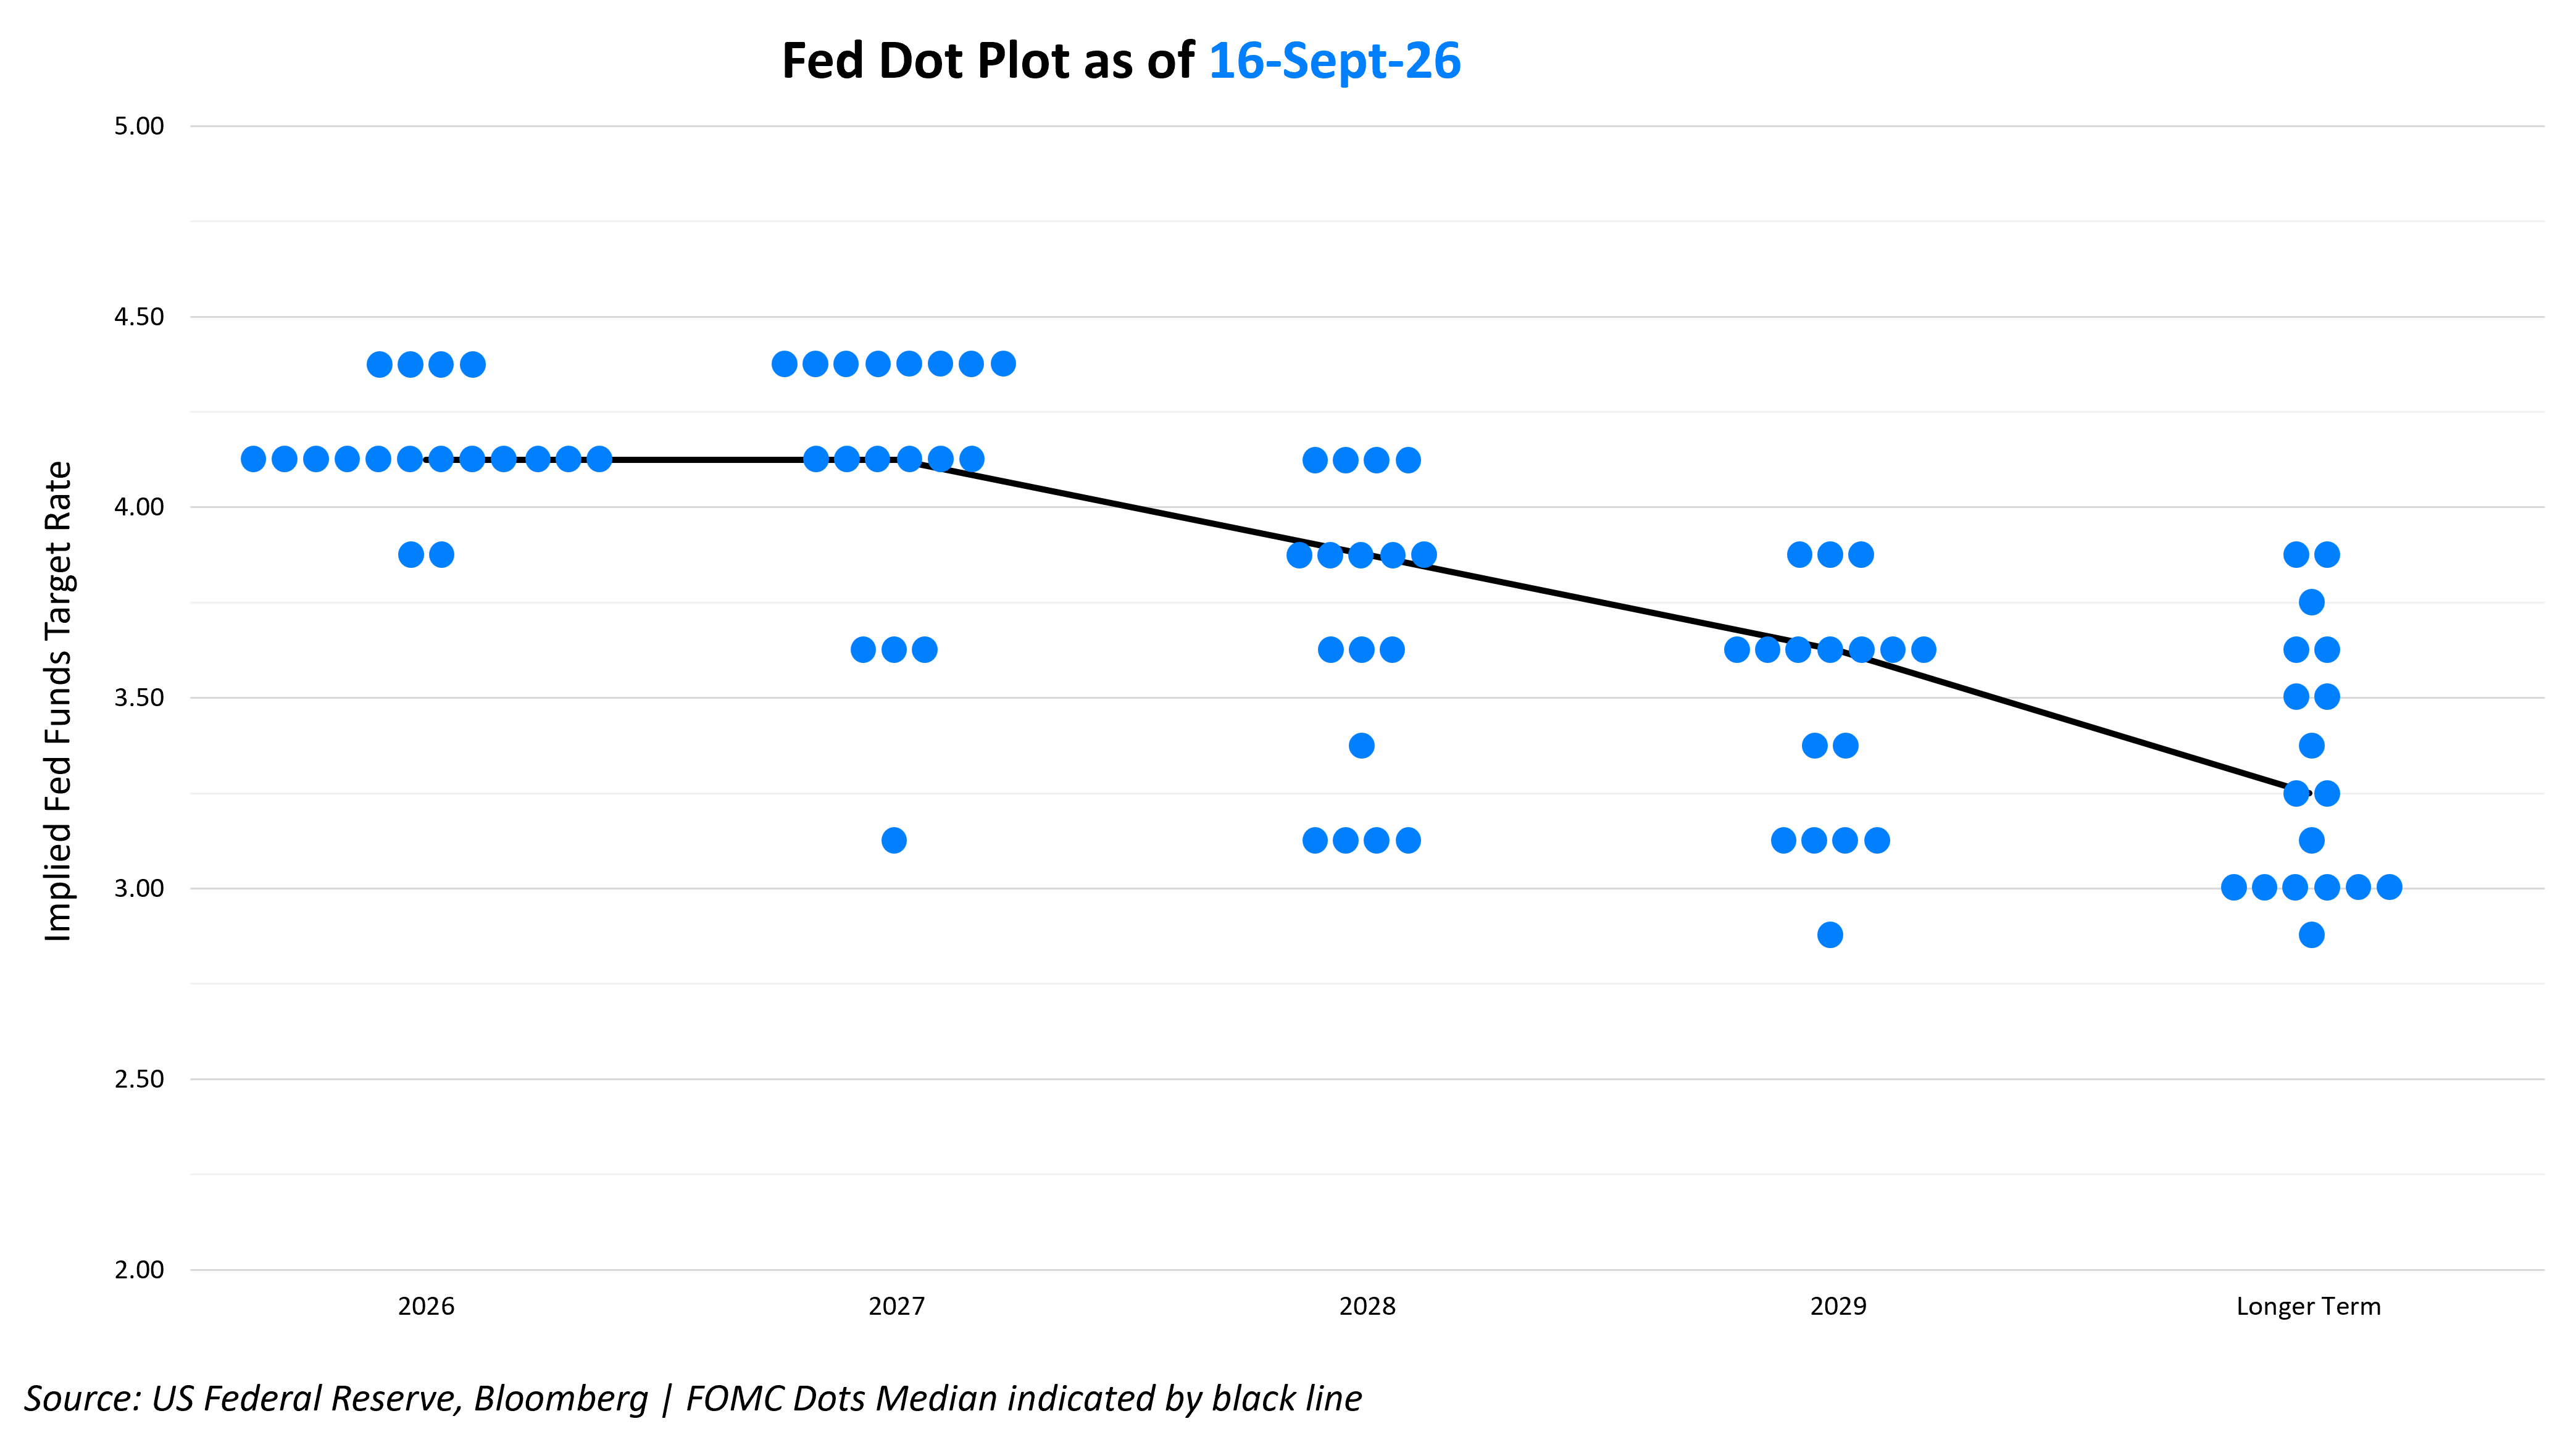
The Fed also raised its 2026 core inflation forecast to 3.4% from 3.3%. However its GDP growth forecast was revised higher to 2.3% from 2.2% and Unemployment rate projection was lowered to 4.1% from 4.3% in June. Fed Chairman, Kevin Warsh said the move would support a ‘timelier return’ to the 2% inflation goal. President Donald Trump said he remains confident in Fed Chair Kevin Warsh following the rate hike and criticized the Fed board as “hostile” and calling for interest rates to fall to 1% or lower. The US 30Y mortgage rates also climbed to 6.97% in the week ended September 11, their highest level in more than a year. Meanwhile, the Hong Kong Monetary Authority raised its benchmark rate by 25bp to 4.25% following the Fed.
Looking at equity markets, the S&P closed lower by 0.5% while the Nasdaq was flat. US IG CDS spreads were 0.3bp tighter, while HY CDS spreads tightened by 1.8bp. European equity markets ended higher. European IG CDS spreads were 1.4bp tighter, and Crossover spreads tightened by 6.8bp. Asian equity markets have opened broadly mixed this morning. Asia ex-Japan CDS spreads tightened by 1.8bp.
Rating Changes
- Newmark Group Inc. Ratings Raised To ‘BBB-’ On Improved Credit Measures; Outlook Stable
- Moody’s Ratings downgrades Domtar’s CFR to Caa1; outlook is negative
- Fitch Revises Edison International’s and Southern California Edison Co.’s Outlooks to Negative
- Fitch Revises PG&E Corporation’s and Pacific Gas and Electric Co.’s Outlooks to Negative
Term of the Day: Fed Dot Plot
The Fed dot plot is a visual representation of interest rate projections of members of the Federal Open Market Committee (FOMC), which is the rate-setting body within the Fed. Each dot represents the Fed funds rate for each year that an anonymous Fed official forecasts. The dot plot was introduced in January 2012 in a bid to improve transparency about the range of views within the FOMC. There are typically 19 dots for each year, representing the median rate of each voting member on the committee.
Talking Heads
On AI’s Existential Fears Meet Wall Street Financing FOMO in Europe
Noah Roth, JPMorgan
“There hasn’t been a great deal of issuance here but there has been intense investor focus,… There’s a lot of FOMO.”
Giacomo Reali, Linklaters
“Regardless of whether or not we have a European champion in AI, Europe will need to have data centers, for European security and for data sovereignty,”
On Firms Shying Away From Long-Dated Bonds – Neil Sun, RBC Global Asset Management Inc
“With yields remaining elevated, it is increasingly challenging for corporate treasurers and CFOs to make the case for long-dated funding,” “There is no near-term reversal in sight as robust US growth and AI-driven capex support rates remaining higher for longer.”
On Fed’s Hawkish Hike to Pressure Asian Currencies – Tim Waterer, KCM Trade
“With at least one more hike expected in this cycle, yields and the dollar have moved higher, while growth-sensitive assets such as stocks are on a less firm footing with the prospect of even tighter monetary conditions still in the pipeline,… Nerves are likely to linger across Asian markets given the newfound level of hawkishness from the Fed and the potential for other central banks to follow suit”
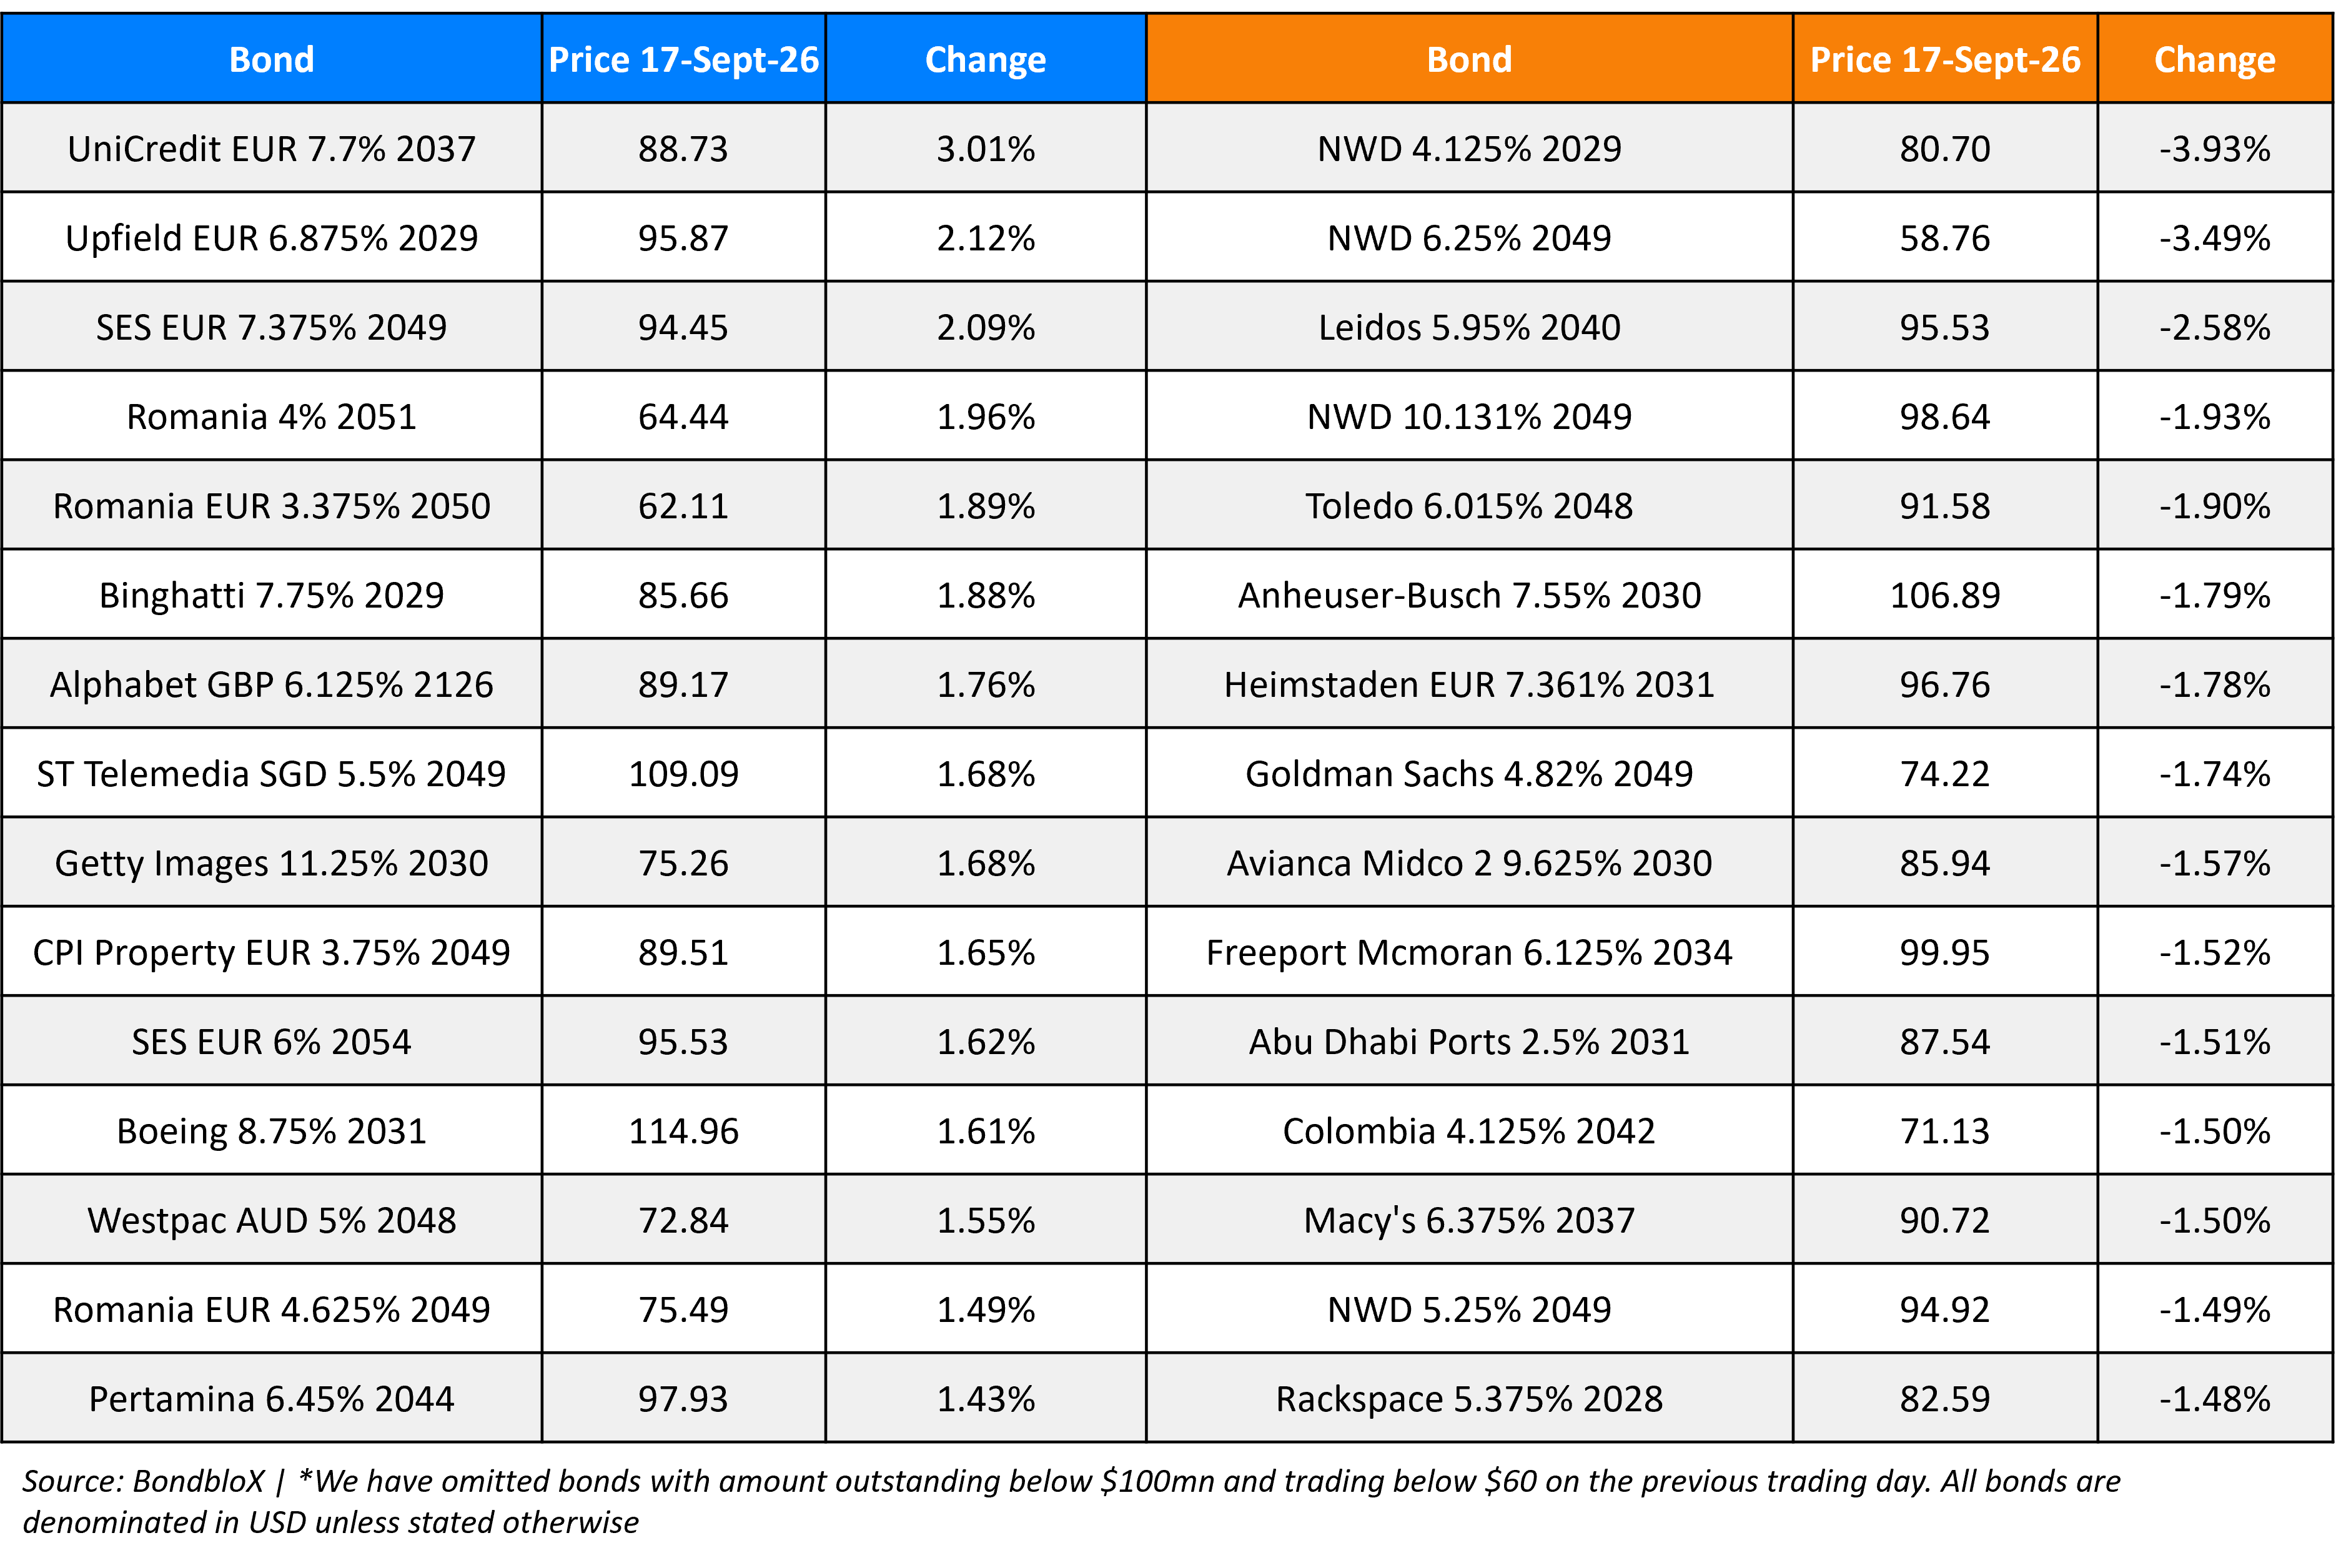
Top Gainers and Losers- 17-Sep-26*
Go back to Latest bond Market News
Related Posts:


Our Awards







BondbloX Pte. Ltd. is regulated by the Monetary Authority of Singapore as a Recognised Market Operator ("RMO") and exempted from Section 49(1) of the Securities and Futures Act (Cap. 289) ("SFA") under Section 49(7) of the SFA.