We use cookies to improve your experience. By using BondbloX, you agree to our use of cookies.
Bond Market News
30Y yield reaching its highest level since 2004
September 25, 2026

The long end of the US Treasury curve rose by 7-8bp, with the 30Y yield reaching its highest level since 2004. On the data front, Initial Jobless Claims for the week ending September 19 came in at 197k vs expectations of 200k and the prior week’s 196k print. Oil prices remained a source of pressure, with Brent rising for a second consecutive session to close at $106.60/bbl. Meanwhile, US and Iranian negotiators are discussing a phased deal that could see Tehran reopen the Strait of Hormuz in exchange for Washington lifting its blockade of Iranian ports.
Separately, New York Fed President John Williams said more work is needed to bring inflation down, while describing market expectations for another rate hike by year-end as reasonable given elevated energy prices and resilient demand. Philadelphia Fed President Anna Paulson said modest further tightening may be needed as underlying inflation remains stubbornly elevated and to balance the inflation risks against the labour market.
Looking at equity markets, the S&P and the Nasdaq both closed flat. US IG CDS spreads were 1.1bp widened, while HY CDS spreads widened by 7.4bp. European equity markets ended lower. European IG CDS spreads were 1.6bp wider, and Crossover spreads widened by 8.4bp. Asian equity markets have broadly opened lower this morning. Asia ex-Japan CDS spreads widened by 2.4bp.
Rating Changes
- Paramount Skydance Issuer Credit Rating Lowered To ‘BB’ From ‘BB+’ On Higher Leverage; Outlook Stable; New Debt Rated
- Fitch Downgrades InPost to ‘BB-‘; Outlook Negative; Withdraws Ratings
- Western Digital Corp. Outlook Revised To Positive On Improving Cash Flow Generation
- Fitch Revises Outlook on Oravel Stays to Positive; Affirms Rating at ‘B’
Term of the Day: High Frequency Indicators
High frequency indicators are economic data points that are published more frequently than other typical data points, which are typically published on a monthly basis. For example, every week in the US, the Department of Labor reports the ‘Unemployment insurance weekly claims’, aka initial jobless claims. Other data points like weekly consumer sentiment indices, Weekly Economic Index (WEI) published by the Federal Reserve Bank of New York, Atlanta Fed’s GDPNow, weekly inflation expectations survey by Michigan, mobility and travel indices etc. are also considered high frequency indicators. These indicators can be inputted into economic models and help give a picture of economic conditions in advance, before the actual data release which may come out only once a month.
Talking Heads
On Surging US Yields Push Spreads With Asia Toward Extremes – Stephen Chiu, Bloomberg Intelligence
“Longer-dated EM Asia bonds are particularly at risk from higher Treasury yields, especially low-yielders such as South Korea and Thailand,… US yields’ rise could either spur foreign outflows, or reduce net foreign inflows into the region’s bonds.”
On Bond Yields at 5% Mark New Era ‘Until Something Breaks’ – Samuel Martinez, Vanguard
“We are in a new regime,… Central bankers’ focus on inflation has traders pricing in multiple hikes.”
On Being Underweight on Hyperscalers on Debt Supply Surge – Goldman Sachs
“We believe there will be a lot of hyperscaler issuance,… For that sector at large we are underweight knowing more issuance will come.”
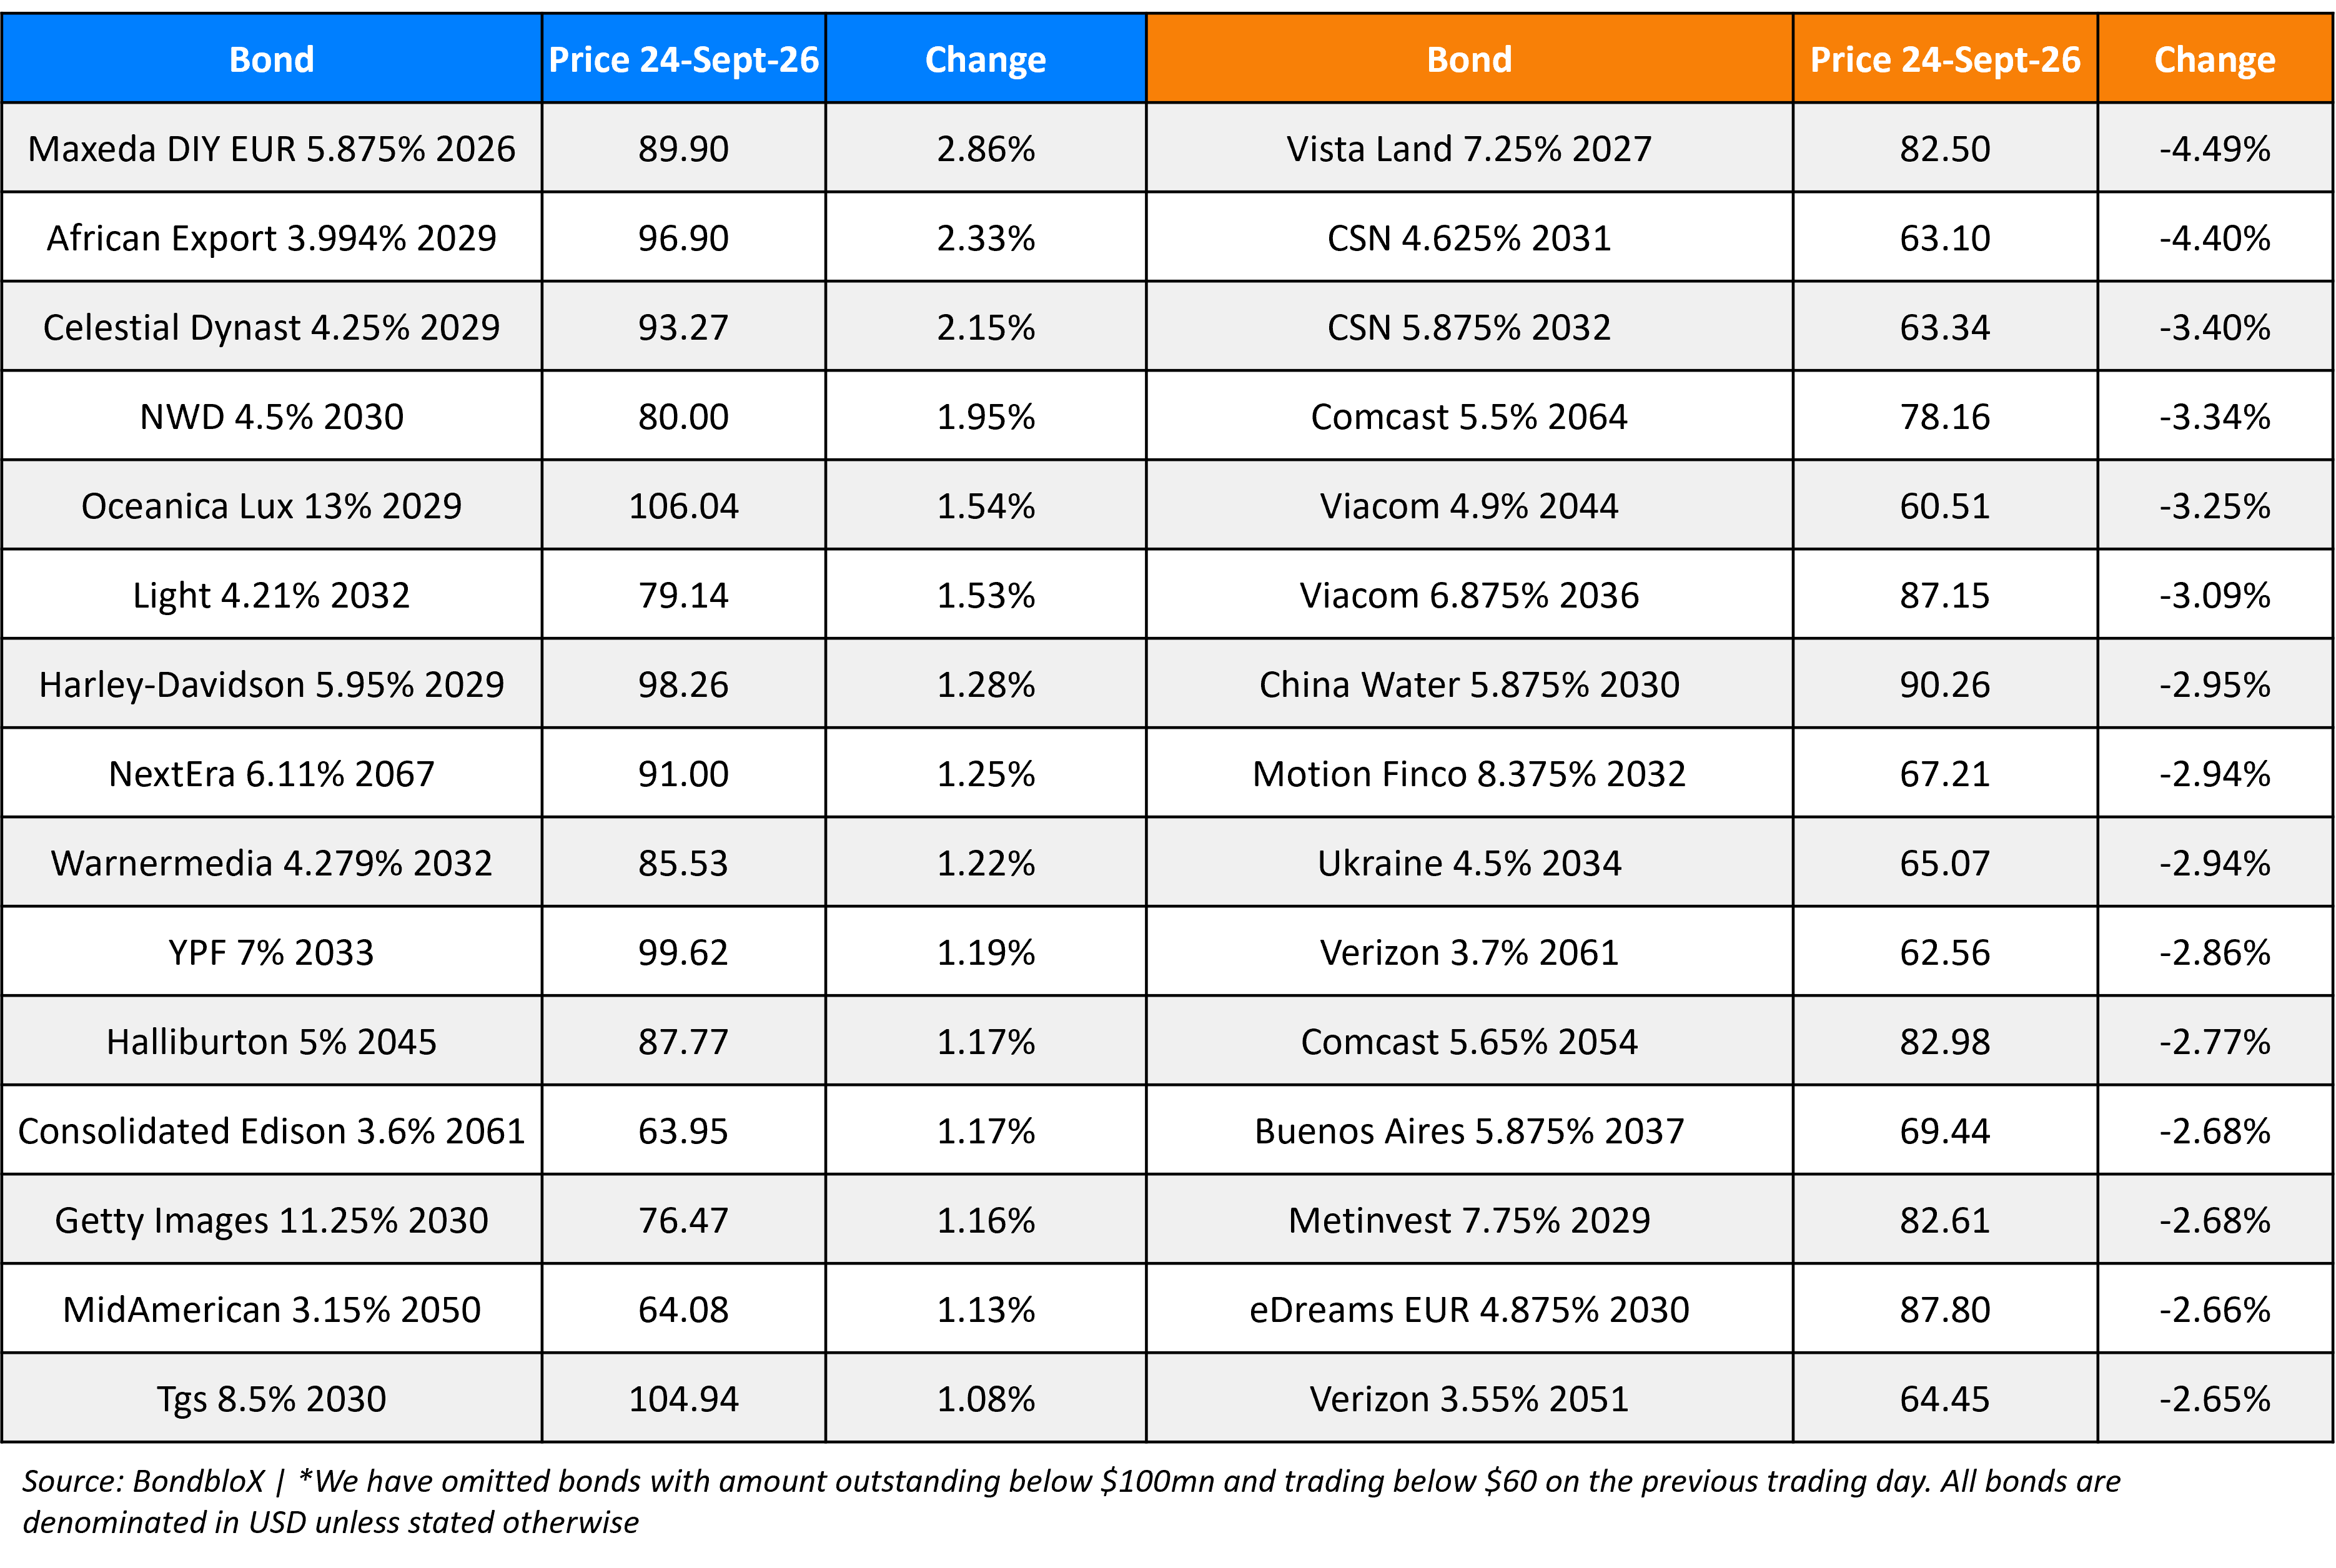
Top Gainers and Losers- 25-Sep-26*
Go back to Latest bond Market News
Related Posts: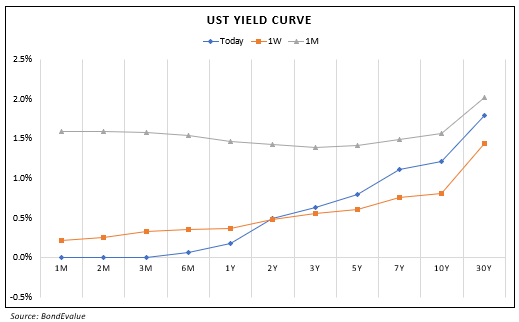


Our Awards







BondbloX Pte. Ltd. is regulated by the Monetary Authority of Singapore as a Recognised Market Operator ("RMO") and exempted from Section 49(1) of the Securities and Futures Act (Cap. 289) ("SFA") under Section 49(7) of the SFA.